Power Test using CycleOps and PowerTap
December 28, 2013
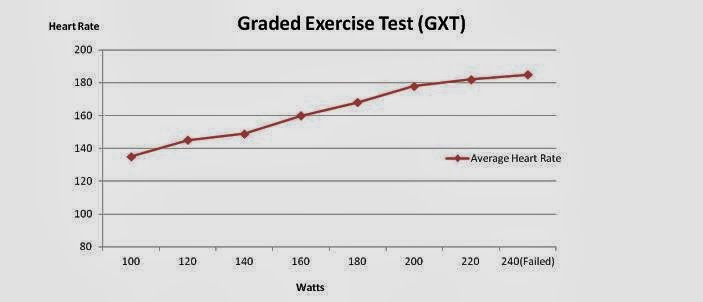
By coach Dave WilliamsThe Graded Exercise Test (GXT) is a measure of cardiovascular fitness. It shows your body’s response to increasing workload. It can also identify lactate threshold wattage and heart rate. A plot of HR versus power shows the cardiovascular response to increasing workload. The lactate threshold is about 10-15% below the point where breathing becomes labored. The corresponding perceived exertion would be about 7 out of 10. An ideal improved training response would indicate each power step achieved at a lower heart rate and lactate threshold reached at a higher wattage with an increase in peak power achievement. Ideally the plotted line should shift down and to the left as fitness improves.
[HR: Heart Rate; RPE:Rate of Perceived Exertion; Ventilations: E(easy), F(fast), H(hard), L(labored)]
GXT Test: December 28, 2013
Lactate
Threshold Heart Rate: LTHR 167
Lactate
Threshold Power (Wattage Range): LTP 180
Training
Zones (Percentage of LTHR = Z1 Recovery, Z2 Base, Z3 Aerobic, Z4 Anaerobic)
Power Profile testing shows your strengths and weaknesses and ultimately what you are capable of. It also helps you to match power output to a particular course or ride. When taken together with the GXT, you will be able to establish accurate training paces based on the correct energy system requirements of each workout session.
Sequence:
10 Minute Warm-up
6 Minute Test (Avg Watts)
5 Minute Recovery
12 Second Test (Avg Watts)
5 Minute Recovery
1 Minute Test (Avg Watts)
10 Minute Recovery
12 Minute Test (Avg Watts)
15 Minute Recovery
30 Minute Test (Avg Watts w/ Avg HR Last 20 Minutes)
PP Test: December 28, 2013
12 Second
Average Watts: 373
1 Minute
Average Watts: 200
6 Minute
Average Watts: 179
12 Minute
Average Watts: 149


Comments
Post a Comment